The Network Was Innocent

- Published on

Debugging an Apple TV with 46 million log documents, six layers of network forensics, and — eventually — five minutes of the device's own logs.
The complaint
The Apple TV never loads preview images in the TV app, and movies often stop after about ten minutes. Both the TV app and Prime.
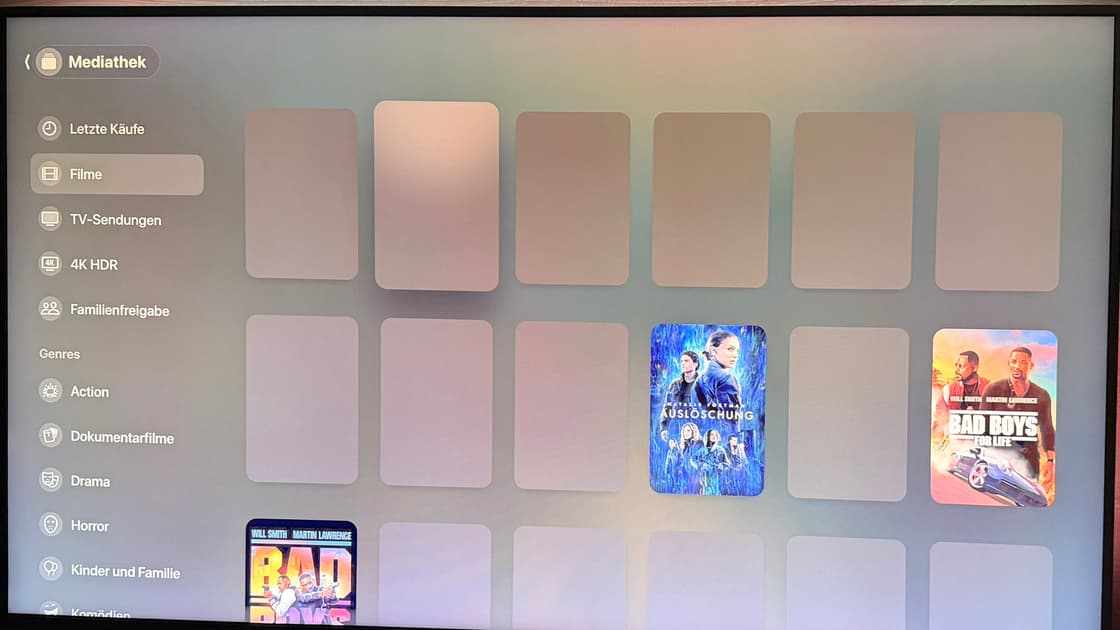
Three covers loaded. Everything else is a placeholder — and stayed that way.
Two symptoms, one device. The kind of thing you'd normally shrug at and reboot.
But this device sits on a homelab with unusually good telemetry: every DNS query from both Pi-holes, every firewall decision from the gateway, and per-client throughput from the UniFi controller — all landing in OpenSearch and InfluxDB, queryable from a terminal. If ever there was a household complaint that could be answered with evidence instead of guesswork, this was it.
So I went looking. It took most of an evening, produced six confident hypotheses, and five of them were wrong.
This is the write-up, including the wrong turns, because the wrong turns are where the transferable lessons live.
Act 1: the obvious suspect
Pi-hole. Of course it's Pi-hole. It's always Pi-hole.
The device queries a set of Apple and Amazon service domains, and the blocklists were eating several of them:
gs-loc.apple.com                        20,048   blocked
apple.com                                9,989   blocked   ← the bare apex
xp.apple.com                             9,101   blocked
global.telemetry.insights.video.a2z.com  2,319   blocked   ← Prime Video
partiality.itunes.apple.com                328   blocked   ← TV app metadata
partiality.itunes.apple.com is Apple's personalisation service — the shelf that was missing artwork. global.telemetry.insights.video.a2z.com is Prime Video's playback-insights endpoint. Two blocked domains, two symptoms, neat mechanism.
First trap, and it's a good one. My instinct was to filter blocked lookups by client. That can never work, and the reason is structural: a blocked lookup writes two dnsmasq lines, and only the first carries the client.
query[A] doubleclick.net from 192.168.22.230   action=query,   has client
gravity blocked doubleclick.net is 0.0.0.0     action=blocked, NO client
Query dns.client AND dns.action:blocked and you get zero hits — forever, on every network, regardless of what's actually being blocked. You have to match on domain and cross-reference. If I hadn't known that, I'd have concluded "nothing is blocked for this device" and moved on.
So: disable blocking, test, confirm.
It didn't help.
Second trap, and this one was mine. I disabled blocking for five minutes to test a symptom described as "stops after about ten minutes." The playback half of that test was impossible to pass by construction. I recorded DNS blocking as "eliminated" on the strength of a test that could not have detected it.
I had to reopen that later and run it properly — 45 minutes. The symptom recurred inside the window. Then it was eliminated.
Lesson: a test shorter than the symptom's onset time is not a test. Check that your observation window can actually contain the thing you're looking for.
Act 2: the network, six ways
With DNS in doubt, I went down the stack. The device is wired, so this was tractable.
Switch port. 1 Gbps, zero RX/TX errors, 0.026% drops. Then the switch was rebooted for unrelated reasons, resetting the counters — and it came back at 1 Gbps with zero errors again. A pristine baseline, twice.
IPv6. This turned out to be the most interesting layer, because the device is 99.5% IPv6: 42,718 DNS queries in seven days over v6, against 358 over v4. Any IPv4-only diagnostic was looking at 0.8% of reality.
It also holds 19 simultaneous IPv6 addresses — privacy extensions churning temporary addresses — so per-address queries are useless and you have to work in /64s. That's only possible because dns.client is mapped as the ip type in the index, which makes CIDR matching work in a Lucene query. Map it as a string and this entire line of investigation is closed to you.
MTU. The WAN is PPPoE, so the path MTU is 1492, not 1500. That's a classic blackhole: if ICMPv6 "Packet Too Big" is filtered, small packets work and large ones vanish — which would produce exactly these symptoms. Metadata loads, images don't; video starts, then stalls.
It was a beautiful theory. It was wrong:
ping6 -M do -s 1444  →  OK    (1492 total)
ping6 -M do -s 1452  →  FAIL  (1500 total)
route cache after    →  mtu 1492 learned ✓
bulk transfer over v6 →  16.2 MB @ 12.5 MB/s
PTB is delivered, the kernel learns the MTU, and bulk IPv6 runs at line rate.
The VLAN gap. All of that was measured from a server on a different VLAN. Honest investigations have to name their gaps, so I did — and then it turned out the MacBook I was working on was on the same VLAN as the Apple TV. Same gateway, same segment. Re-ran everything: identical results. Gap closed.
The CDN itself. is1-ssl.mzstatic.com — the host that serves TV app artwork — reachable over both v4 and v6 with ~18 ms connects. It's Fastly, the same CDN I'd just pulled 16 MB from over IPv6 at full speed.
Six layers. All clean.
A genuine bug, found in passing
While checking how the cluster resolves LAN names, I found something unrelated and worse than what I was looking for:
CoreDNS        -> gw.example.net.   <WAN IP>        ← wrong
Pi-hole node4  -> nas.internal.     192.168.22.7
Pi-hole node6  -> nas.internal.     192.168.22.7
CoreDNS had no server block for the internal domain, and a public wildcard caught the query instead — so pods resolving an internal name got the WAN address of their own gateway. Not NXDOMAIN. A confidently wrong answer, which is far harder to spot, because name resolution succeeds all the way to a connection against the wrong host.
Nothing in the cluster depended on it yet, which is precisely why it would have bitten silently later. Fixed with one more zone forwarded to the Pi-holes, policy sequential — because with the default random, a third of lookups would reach the gateway and get the public answer, and the bug would return intermittently. Intermittent is worse than broken.
Act 3: catching it in the act
Eliminating things is unsatisfying. I wanted the failure on a graph.
So I built a Grafana dashboard for a single client — throughput and switch-port health from InfluxDB, DNS behaviour from OpenSearch, one shared time axis — and waited.
Third trap. The per-minute throughput looked dramatically bursty, with zeros scattered through healthy playback. I read those as stalls. They weren't: the poller runs on a ~60-second cycle, so sub-minute buckets alias — every other 30-second bucket is structurally zero, and some minute-level zeros are artifacts of sampling, not gaps in traffic.
Lesson: know your collection interval before you interpret your time series. Aggregate to windows comfortably larger than it. I used 5-minute totals after that, and the noise vanished.
Then a failure happened, and the graph was unambiguous:
20:00–20:20     0–28 MB/5min    (0.2–0.8 Mbps)   ← a session that died
20:25–21:00   714–1323 MB/5min  (19–35 Mbps)     ← a healthy session
21:00          1323 MB/5min     (35.3 Mbps)      ← PEAK, at the moment of failure
21:02           594 MB           (15.8 Mbps)     ← traffic still flowing
The second failure aborted at peak throughput, with no lag, no stutter, no buffering — an instant black screen. And bytes kept arriving afterwards.
That single observation is worth more than everything before it. A player starved of data degrades before it dies: quality drops, it stutters, a spinner appears. This one stopped cleanly at full speed. The network delivered everything asked of it, and the device chose to stop.
Meanwhile every other client on the network sailed through, the WAN sat at 9 ms, and the line demonstrably did 56+ Mbps. Not contention. Not latency. Not bandwidth.
Act 4: the theory that fit everything and was still wrong
One more clue arrived: YouTube on the same Apple TV never fails. Mac and iPad, same Apple account, never fail.
So what separates YouTube from the TV app and Prime? On tvOS, both of the failing apps use FairPlay DRM. YouTube doesn't. DRM playback also requires HDCP on the HDMI link, and an HDCP re-authentication failure stops protected content instantly with a black screen while unprotected content is unaffected.
It explained everything:
| Observation | Fits |
|---|---|
| TV app and Prime fail | both use FairPlay |
| YouTube never fails | no FairPlay, no HDCP |
| Mac and iPad fine | different DRM path, different display link |
| Instant black screen, no degradation | protected-content abort |
| Variable timing | periodic re-auth, not a fixed timeout |
| Six clean network layers | because the network was never the problem |
Elegant. Coherent. Predictive. Wrong.
Lesson: a hypothesis that explains every observation is not thereby correct. Explanatory power is cheap — any sufficiently flexible theory can absorb a fixed set of facts. What distinguishes a right theory from a plausible one is a prediction you can go and test.
Act 5: five minutes of the device's own logs
So I went and tested it. Pair the Apple TV to Xcode, stream the unified log, export 19 MB, grep for HDCP.
One hit — a routine property-lookup miss. Zero HDCP failures. Zero video FairPlay errors; all FairPlay activity was Apple Music, and all of it succeeded.
Then I looked at what was in there. 18,240 errors in five idle minutes. Grouped them. And there it was:
2,854 × "No space left on device"   (errno 28, ENOSPC)
        across 30 processes, continuous from the first second to the last

1,459 × SQLite failures (unopened database, misuse, cannot open file)

AppleTV      :: AMSBag: Failed to persist bag — fileAccessError
amsaccountsd :: unixWrite(.../AppleMediaServices/Accounts/.../cookies.sqlitedb-wal)
The device's storage was full.
The TV app could not persist Apple Media Services state at all. No metadata cache, no artwork cache, no durable session state. That is why artwork never loaded. That is why playback aborted mid-stream with a generic "problem loading this content." And that is exactly why YouTube was immune — it doesn't touch Apple Media Services.
Every symptom, including the app-selectivity pattern that had made the DRM theory so seductive, falls out of one errno 28.
The worst mistake of the evening
I had checked storage. Early on, I asked, and the answer came back: 64 GB device, about 1.4 GB of apps. I crossed it off.
That screen shows app storage only. It says nothing about the data volume, nothing about caches, nothing about what actually fills a tvOS device. I treated a number that didn't measure the thing as proof about the thing, and then spent hours on network forensics and a DRM theory that the logs refute in one grep.
The first instinct was right. The test for it was wrong.
Lesson: when you eliminate a hypothesis, write down what measurement killed it. "I checked storage" is not a record. "Settings reported 1.4 GB of apps" is — and written down, it's immediately obvious that it doesn't answer the question.
What actually transferred
Negative results are results. Ruling out the network wasn't wasted. It's what made the 21:00 observation legible — knowing the network was healthy is why "it aborted at peak throughput" was decisive rather than ambiguous.
Instrument the layer where the fault lives. I had superb telemetry for every layer except the one that mattered. Network monitoring cannot see a device-side fault, no matter how good it is, and no amount of querying 46 million documents was going to surface an errno 28 that was never shipped anywhere.
Go to the device's own logs sooner. When a device misbehaves and the network looks clean after two or three checks, stop checking the network.
Know your instruments' failure modes. Three separate times, the data lied in a way that only domain knowledge caught: blocked DNS lines that carry no client, metrics that alias below the polling interval, and a storage figure that measures something other than storage.
Tooling notes, for the next person
devicectl device sysdiagnoseanddevicectl diagnoseboth fail on tvOS withDiagnoseError error 0, after successfully establishing the tunnel. Console.app is the working path. Modern Xcode no longer auto-discovers Apple TVs — you must pair explicitly.- macOS's
logCLI has no device option at all. Remote streaming is Console.app only. - Console's log levels are localised. On a German system the error level reads
fehler, sogrep errorfinds nothing. I nearly missed 18,240 errors to a locale.
Epilogue
The fix is a factory reset — and it doubles as the final diagnostic. If storage stays healthy afterwards, it was cache accumulation. If it fills again within weeks, the NAND on an eight-year-old device is wearing out and retiring blocks, and the box needs replacing.
Either way, the answer was never on the network.
Some identifiers have been redacted. Internal RFC1918 addresses are left intact; they're not secrets and the post is unreadable without them.